
Every day, marketing teams drown in data while struggling to answer one simple question: “Is our marketing actually working?”
The answer lies in three critical metrics that separate successful marketers from those burning budgets without results. Yet 68% of marketers admit they’re confused about which metrics truly matter for business growth.
This definitive guide breaks down ROI, ROAS, and CPA – the only three marketing metrics you need to master. You’ll learn exactly when to use each metric, how to calculate them correctly, and what benchmarks indicate success or failure.
By the end of this article, you’ll have a clear framework for measuring marketing performance that drives real business decisions.
Why Most Marketing Metrics Are Misleading
Before diving into the metrics that matter, let’s address the elephant in the room: metric overload.
Marketing platforms flood you with dozens of metrics – clicks, impressions, reach, engagement rates, frequency, CPM, CTR. While these vanity metrics might look impressive in reports, they don’t answer the fundamental business question: “Are we making money from our marketing?”
Only three metrics directly connect marketing activities to business profitability:
- ROI (Return on Investment): Overall profitability
- ROAS (Return on Ad Spend): Campaign efficiency
- CPA (Cost Per Acquisition): Customer acquisition efficiency
Master these three, and you’ll make better marketing decisions than 80% of your competitors.
ROI (Return on Investment): The Ultimate Profitability Metric
————————————
What is ROI?
Return on Investment (ROI) measures the total profit generated from your marketing investment compared to what you spent. It’s the gold standard for determining whether your marketing efforts are profitable.
ROI Formula
ROI = (Revenue - Marketing Cost) / Marketing Cost × 100
Alternative Formula:
ROI = (Profit / Marketing Cost) × 100
ROI Calculation Example
Scenario: You spend ₹4,00,000 on a marketing campaign that generates ₹20,00,000 in revenue.
ROI = (₹20,00,000 - ₹4,00,000) / ₹4,00,000 × 100
ROI = ₹16,00,000 / ₹4,00,000 × 100
ROI = 4 × 100 = 400%
Translation: For every ₹1 spent, you earned ₹4 in profit.
When to Use ROI
Best for:
- Measuring overall marketing program success
- Comparing different marketing channels
- Making budget allocation decisions
- Reporting to executives and stakeholders
- Long-term strategy planning
ROI Benchmarks:
- Excellent: 400%+ (5:1 return)
- Good: 200-400% (3:1 to 5:1 return)
- Break-even: 0% (1:1 return)
- Losing money: Below 0%
ROI Limitations
- Doesn’t account for different time frames
- May not capture long-term customer value
- Can be misleading for brand awareness campaigns
- Requires accurate revenue attribution
ROAS (Return on Ad Spend): The Campaign Efficiency Champion
———————————
What is ROAS?
Return on Ad Spend (ROAS) measures how much revenue you generate for every dollar spent on advertising. Unlike ROI, ROAS focuses specifically on advertising spend rather than total marketing costs.
ROAS Formula
ROAS = Revenue from Ads / Ad Spend
ROAS Calculation Example
Scenario: You spend ₹1,60,000 on Google Ads and generate ₹8,00,000 in revenue.
ROAS = ₹8,00,000 / ₹1,60,000
ROAS = 5 (or 5:1)Translation: For every ₹1 spent on ads, you generated ₹5 in revenue.
Want to run your own numbers? Try our PPC Ad Spend ROI Calculator to see this calculated automatically.
When to Use ROAS
Best for:
- Optimizing individual ad campaigns
- Comparing ad platform performance
- Day-to-day campaign management
- Setting bid strategies
- Quick performance assessments
ROAS Benchmarks by Industry:
- E-commerce: 4:1 to 6:1
- SaaS: 3:1 to 5:1
- Lead Generation: 5:1 to 10:1
- Retail: 4:1 to 8:1
- B2B Services: 3:1 to 7:1
ROAS vs ROI: Key Differences
Metric | ROAS | ROI |
|---|---|---|
| Scope | Ad spend only | Total marketing investment |
| Calculation | Revenue ÷ Ad Spend | Profit ÷ Marketing Cost |
| Usage | Campaign optimization | Business profitability |
| Time Frame | Short-term | Long-term |
| Focus | Revenue generation | Profit generation |
ROAS Limitations
- Doesn’t account for profit margins
- Ignores other marketing costs
- May not reflect true profitability
- Can be misleading for high-volume, low-margin businesses
CPA (Cost Per Acquisition): The Customer Efficiency Metric
——————————
What is CPA?
Cost Per Acquisition (CPA) measures how much it costs to acquire one customer through your marketing efforts. It’s the most actionable metric for optimizing marketing efficiency.
CPA Formula
CPA = Total Marketing Spend / Number of Customers Acquired
CPA Calculation Example
Scenario: You spend ₹2,40,000 on marketing and acquire 30 new customers.
CPA = ₹2,40,000 / 30 customers
CPA = ₹8,000 per customerTranslation: It costs you ₹8,000 to acquire each new customer.
Planning a campaign budget around your target CPA? Our PPC Budget Calculator can help you work backward from your acquisition targets.
When to Use CPA
Best for:
- Setting campaign budgets
- Comparing channel efficiency
- Optimizing conversion funnels
- Scaling profitable campaigns
- Determining bid limits
CPA Benchmarks by Industry
- E-commerce: ₹800-₹4,000
- SaaS (B2B): ₹8,000-₹40,000
- Insurance: ₹16,000-₹48,000
- Real Estate: ₹8,000-₹40,000
- Healthcare: ₹12,000-₹40,000
Note: These benchmarks vary significantly based on customer lifetime value
The Golden Rule: CPA vs Customer Lifetime Value
Your CPA should never exceed your Customer Lifetime Value (CLV). The ideal ratio is:
CPA ≤ CLV ÷ 3
Example: If your average customer is worth ₹9,000 over their lifetime, your CPA should be ₹3,000 or less.
CPA Limitations
- Doesn’t consider customer quality
- May not account for long-term value
- Can be misleading without CLV context
- Attribution challenges in multi-touch journeys
The Complete Marketing Metrics Framework
How to Use All Three Metrics Together
Smart marketers don’t rely on just one metric. Here’s how to use ROI, ROAS, and CPA as a comprehensive measurement system:
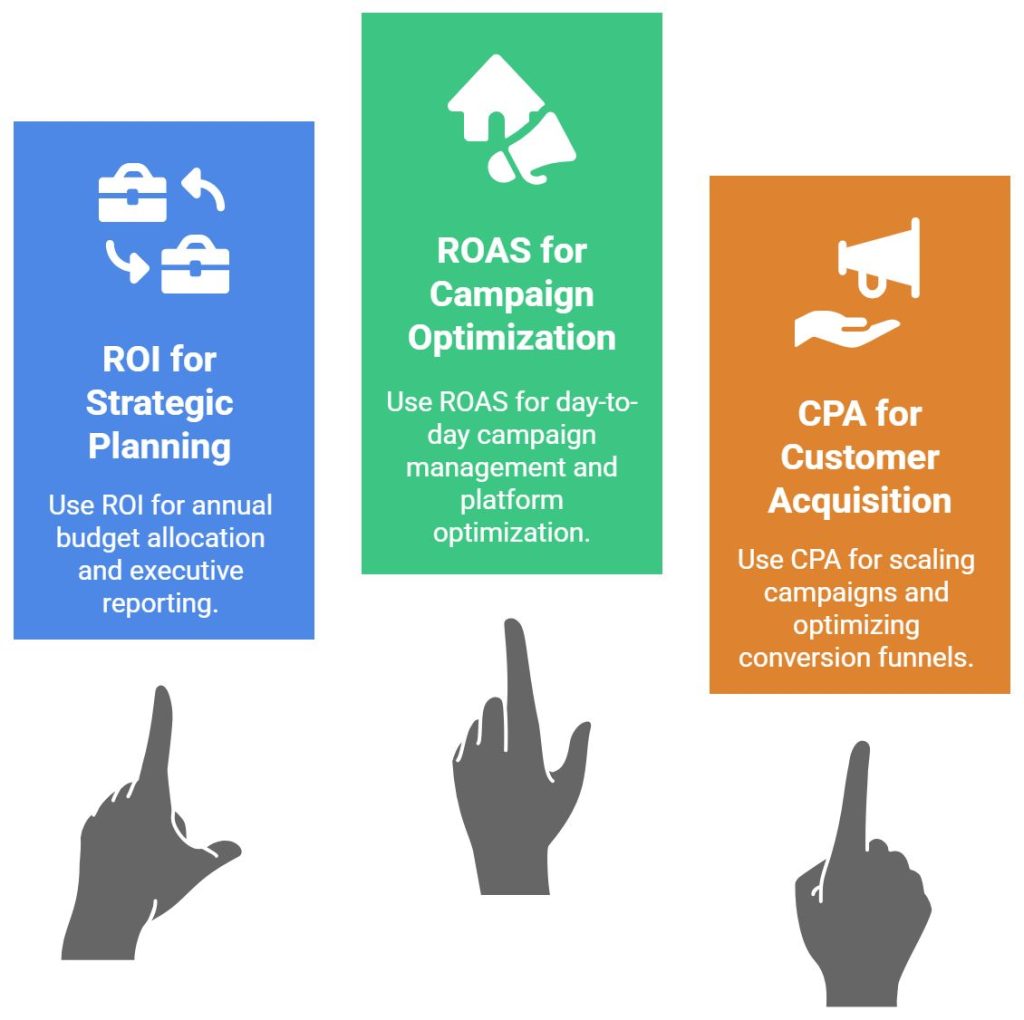
1. Strategic Planning: Use ROI
- Annual marketing budget allocation
- Channel investment decisions
- Executive reporting and justification
2. Campaign Optimization: Use ROAS
- Day-to-day campaign management
- Platform comparison and optimization
- Bid strategy adjustments
3. Customer Acquisition: Use CPA
- Campaign scaling decisions
- Conversion funnel optimization
- Customer acquisition target setting
Real-World Example: Complete Analysis
Campaign: Facebook Ads for E-commerce Store
Data:
- Ad Spend: ₹4,00,000
- Revenue Generated: ₹20,00,000
- Customers Acquired: 100
- Profit Margin: 40%
- Gross Profit: ₹8,00,000
Analysis:
ROAS: ₹20,00,000 ÷ ₹4,00,000 = 5:1
Good performance for e-commerce
CPA: ₹4,00,000 ÷ 100 = ₹4,000 per customer
Reasonable for this industry
ROI: (₹8,00,000 – ₹4,00,000) ÷ ₹4,00,000 × 100 = 100%
Doubling the investment – excellent
Decision: This campaign is performing well across all metrics. Scale the budget while monitoring for efficiency drops.
Advanced Metric Calculations and Variations
Blended vs Channel-Specific Metrics
Blended Metrics: Include all marketing costs and revenue
Blended ROAS = Total Revenue / Total Marketing Spend
Channel-Specific Metrics: Focus on individual channels
Google Ads ROAS = Google Ads Revenue / Google Ads Spend
Time-Based Variations
7-Day ROAS: Revenue within 7 days of ad interaction
30-Day ROAS: Revenue within 30 days of ad interaction
Lifetime ROAS: Total customer value over entire relationship
Cohort-Based CPA
Track CPA performance by customer acquisition date:
Monthly Cohort CPA = Monthly Ad Spend / Customers Acquired That Month
Common Metric Mistakes (And How to Avoid Them)
Mistake #1: Focusing on Vanity Metrics
Wrong: Celebrating high impressions and clicks
Right: Measuring revenue and profit generation
Mistake #2: Ignoring Attribution Windows
Wrong: Using 1-day attribution for complex purchases
Right: Setting appropriate attribution windows (7-30 days)
Mistake #3: Not Accounting for Lifetime Value
Wrong: Optimizing for immediate returns only
Right: Balancing short-term CPA with long-term CLV
Mistake #4: Comparing Different Business Models
Wrong: Using the same ROAS targets for different industries
Right: Setting benchmarks based on your specific business model
Mistake #5: Not Including All Costs
Wrong: Calculating ROI without including management fees, tools, and overhead
Right: Including all marketing-related expenses
Setting Up Proper Tracking and Measurement
Essential Tracking Requirements
1. Revenue Attribution
- Google Analytics 4 enhanced e-commerce
- Facebook Conversion API
- Platform-specific conversion tracking
- CRM integration for offline conversions
2. Cost Tracking
- Automated cost importing from ad platforms
- Manual cost entry for organic initiatives
- Tool and software costs allocation
- Team time and overhead costs
3. Customer Identification
- Unique customer ID tracking
- First-time vs returning customer segmentation
- Multi-touchpoint customer journey mapping
Tools for Metric Calculation
Free Tools:
- Google Analytics 4
- Facebook Ads Manager
- Google Ads (built-in metrics)
- Google Sheets (custom calculators)
Paid Tools:
- Triple Whale (e-commerce focused)
- Northbeam (advanced attribution)
- Klaviyo (email + SMS attribution)
- HubSpot (complete marketing suite)
Industry-Specific Metric Strategies
E-commerce
Primary Focus: ROAS and CPA
Key Considerations: Product margins, seasonal fluctuations
Target ROAS: 4:1 to 6:1
SaaS/B2B
Primary Focus: CPA and Customer Lifetime Value
Key Considerations: Long sales cycles, recurring revenue
Target CPA: 1/3 of annual customer value
Local Services
Primary Focus: CPA and ROI
Key Considerations: Geographic constraints, phone call tracking
Target CPA: Target CPA: ₹4,000 – ₹16,000 depending on service value
Lead Generation
Primary Focus: Cost Per Lead (CPL) and Lead-to-Customer Rate
Key Considerations: Lead quality, sales team efficiency
Target Strategy: Optimize for qualified leads, not just volume
Creating Your Marketing Metrics Dashboard
Essential Dashboard Elements
1. Executive Summary View
- Overall marketing ROI
- Monthly revenue attributed to marketing
- Year-over-year growth metrics
- Budget utilization
2. Campaign Performance View
- ROAS by channel and campaign
- CPA trends over time
- Budget allocation recommendations
- Top-performing campaigns
3. Optimization View
- Underperforming campaigns flagged
- Scaling opportunities identified
- Attribution analysis
- Conversion funnel metrics
Dashboard Best Practices
- Update frequency: Daily for active campaigns, weekly for strategic metrics
- Visualization: Use clear charts and color coding for quick insights
- Context: Include benchmark comparisons and historical trends
- Actionability: Highlight specific optimization opportunities
The Metric Hierarchy: What to Optimize First
Level 1: Profitability (ROI)
Goal: Ensure marketing generates profit
Action: Cut unprofitable channels, scale profitable ones
Level 2: Efficiency (ROAS/CPA)
Goal: Maximize returns from ad spend
Action: Optimize targeting, creative, and bidding
Level 3: Scale (Volume with Efficiency)
Goal: Grow while maintaining profitability
Action: Increase budgets on efficient campaigns
Level 4: Innovation (New Opportunities)
Goal: Discover new profitable channels
Action: Test new platforms, audiences, and strategies
Understanding ROI, ROAS, and CPA isn’t just about knowing formulas – it’s about building a data-driven marketing operation that consistently drives business growth.
Your Action Plan:
- Audit your current tracking – Ensure you can accurately measure all three metrics
- Set benchmark targets based on your industry and business model
- Create a unified dashboard that displays all critical metrics
- Implement the metric hierarchy – optimize profitability first, then efficiency
- Review and optimize weekly – Use these metrics to make informed decisions
Remember: The goal isn’t perfect metrics – it’s profitable growth. These three metrics will guide every marketing decision you make, from daily optimizations to annual strategy planning.
Master these metrics, and you’ll never wonder if your marketing is working again.
Ready to Implement Proper Marketing Measurement?
We track ROI, ROAS, and CPA this exact way for our own PPC clients, not just as a reporting formality, but as the basis for every budget decision we make on their behalf.
At Digital Dawn, we help businesses implement comprehensive marketing measurement systems that track what actually matters for growth. Our team specializes in setting up proper attribution, creating actionable dashboards, and optimizing campaigns for maximum ROI.
Want to see how we can improve your marketing metrics?
📞 Call/WhatsApp: +91-9644940497
📧 Email: digitaldawnin@gmail.com
Stop guessing whether your marketing is working. Contact us today for a free marketing measurement audit and discover how to optimize your ROI, ROAS, and CPA for maximum business growth.